Blame it on the mortgage rates. Blame it on the scarce supply.
There are more than enough reasons to blame for the dismal state of the U.S. housing market, which are now quantified and categorized in NBC News’ Home Buyer Index.
Here are some key takeaways from our first report:
Homebuying is hard around the country
The April Home Buyer Index report found nationwide difficulty to be at 87.3 out of a possible 100, a score that represents extremely tough conditions. And homebuyers across the country are feeling the squeeze: 26 states have at least one county in the list of the 100 most difficult counties. Colorado is home to the three most difficult counties in the country: Garfield, Routt and Mesa counties.
All three Colorado counties have high cost and competition scores, indicating that homes are both expensive and going quickly when they hit the market. In Routt County’s Steamboat Springs, buyers face a housing boom so intense that even high earners can’t afford homes.
But it’s not just overall cost that is driving difficulty. Forty-three of the 100 most difficult counties in which to buy a home have median list prices below the national average.
“I think it’s been a widespread issue that’s not just the high-cost areas,” said Daniel McCue, senior research associate at Harvard’s Joint Center for Housing Studies. “It’s very much across the nation.”
McCue pointed to Columbus, Ohio, as an example of a place where a historically stable market suddenly began to surge during the Covid pandemic, noting that Columbus had “somewhere around 40% growth in prices between 2021 and 2023 — something that hadn’t been seen in decades.”
The Home Buyer Index in Franklin County, Ohio, where Columbus is primarily located, shows difficulty has increased steadily since the beginning of 2020, rising from 39.5 in December 2020 to 74.0 in April.
Home supply falling short
Today’s homebuyer faces a smaller pool of options than in previous years. And there’s little relief in sight, as the pace homes are arriving on the market remains outstripped by demand.
The NBC News Home Buyer Scarcity Index — which accounts for existing inventory, new construction and other factors — reflects that, with a value of 87.8 — far higher than before the pandemic, when values rarely exceeded 60.
“The spoken rule is that six months of supply has traditionally indicated a balanced market,” McCue said. “At this point, we’re at historically low monthly supply.”
Supply has remained below that level since May 2020. An NBC News analysis of Redfin data shows that, nationally, the available housing stock can meet 2.6 months of demand, given the current rate at which homes are leaving the market. At the same time, the number of new listings’ hitting the market remains low — suggesting that those waiting for more options may need to wait a little longer.
Demand — and competition — is elevated
Among the three difficulty sub-indexes specific to housing, competition is the leading driver of difficulty in nearly half of the counties measured.
Nationally, the Home Buyer Competition Index — which captures how quickly homes move out of the market — shows that competition has soared in the last five years, rising from a low of 39 in April 2019 to 99 — almost the max — for all of 2021 and most of 2020. And although competition has moderated a bit in 2023 and 2024, it still remains far above pre-pandemic levels.
Central California’s Tulare County is one of the most competitive markets in our April report. Roughly 55% of homes in Tulare County left the market within two weeks in April. And 36% sold above list price — 6 percentage points above the national figure.
Out of sight
Nationally, the average household’s purchasing power has eroded sharply. The price of a home the average homebuyer could afford has nearly halved since December 2020.
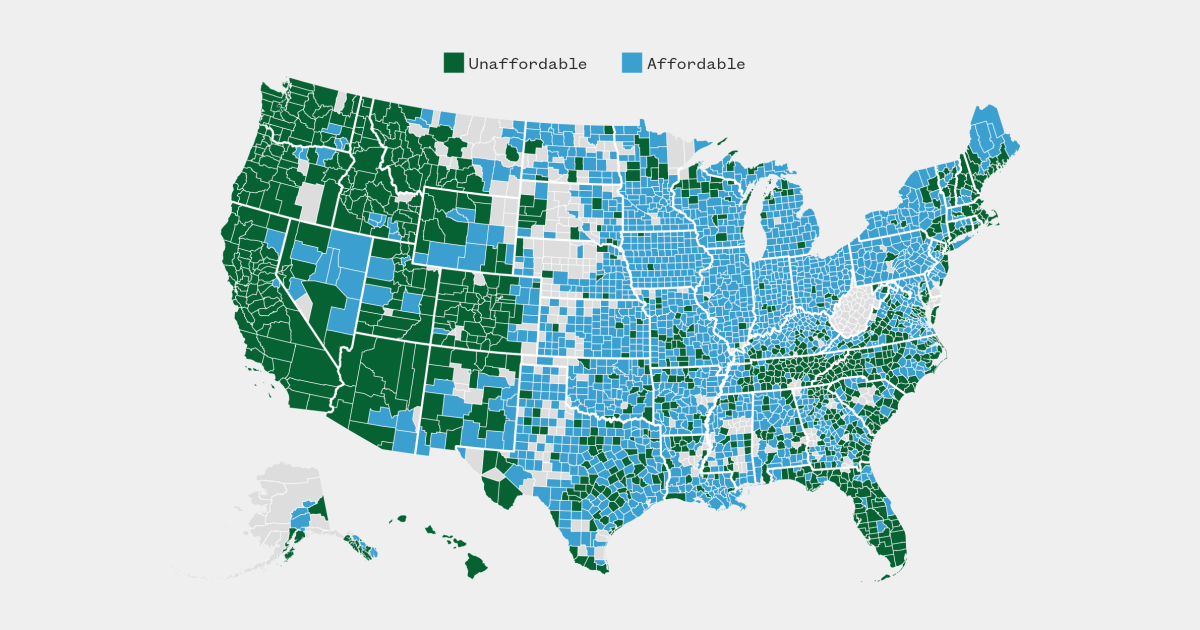
In 2019, a household earning the median income could afford to buy the median-priced home in 94% of U.S. counties. Today, a median-income household would be able to afford only a median-priced home in 63% of counties, as homes across Florida and much of the West have climbed out of reach.
"difficult" - Google News
May 23, 2024 at 06:00PM
https://ift.tt/R4GeAT6
Data, maps and charts on how difficult it is to buy a home in 2024. - NBC News
"difficult" - Google News
https://ift.tt/42EQrki
https://ift.tt/9oqCpbd
Bagikan Berita Ini


0 Response to "Data, maps and charts on how difficult it is to buy a home in 2024. - NBC News"
Post a Comment